The Defect Frequency Report is context specific. For example, if you run the report in Speculative Housing - the returned results will only include Defects for plots in Speculative Housing, not Partnership Residential or Commercial Projects.
This report shows which Defect Categories have been used most in descending order.
The Report can be exported to Excel or PDF by switching the export toggle to the right which will change the colour to blue. Click 'Generate Report'.
A copy of the Report will then show within Admin > Todays Reports and a copy will be sent via email also.
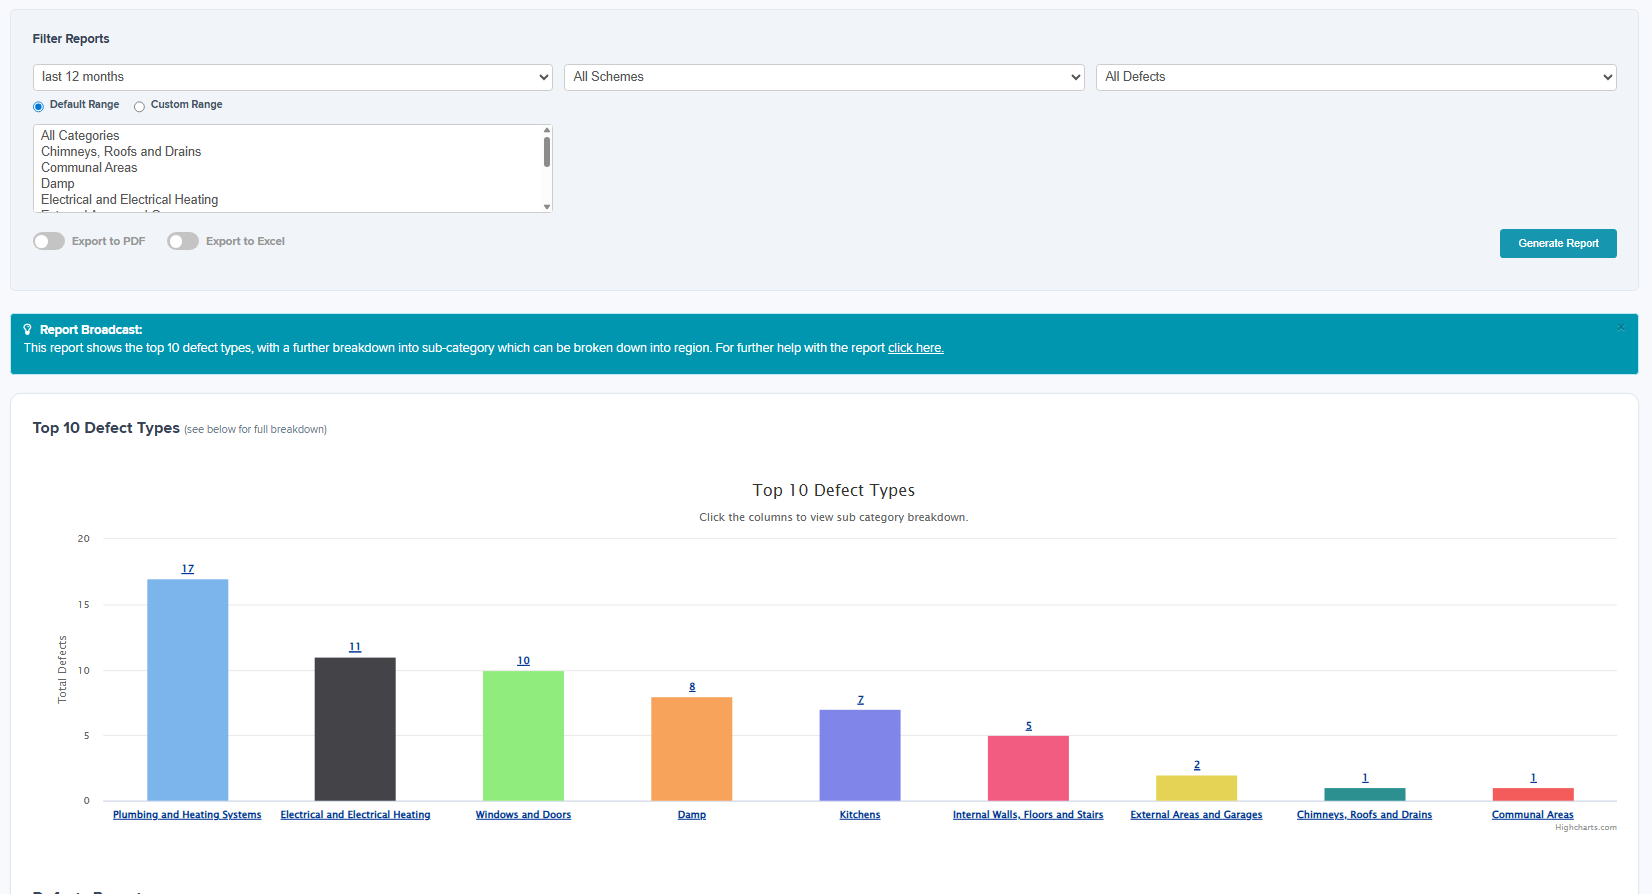
Top 10 Defect Categories
A bar chart is based on the amount of times that Defect Category has been used to log a Defect.
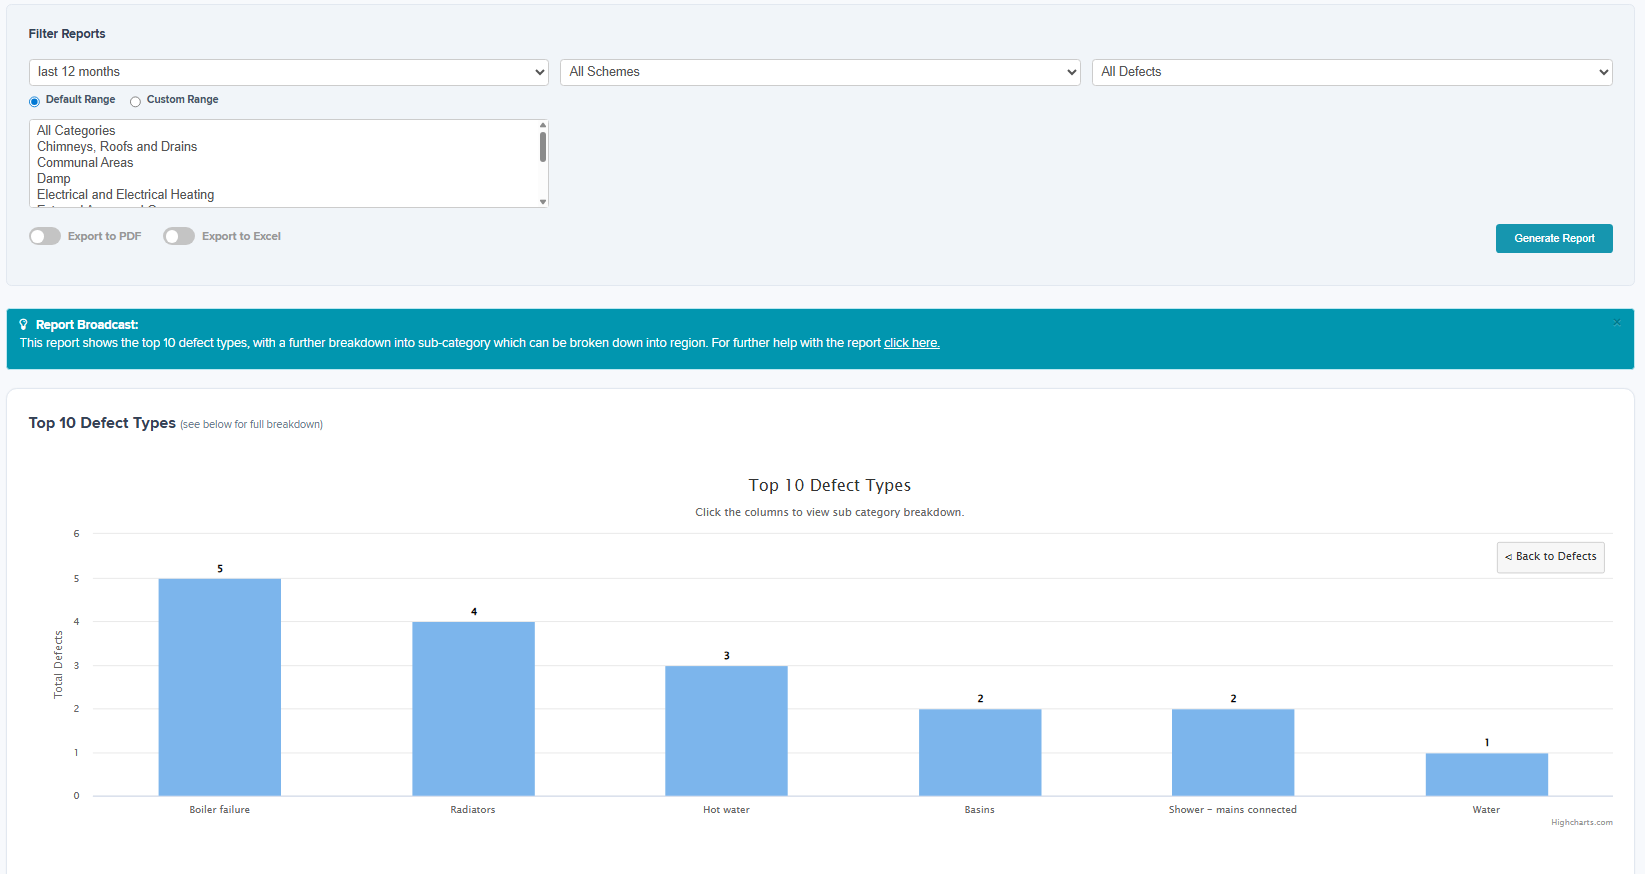
You can select a Defect Category to show which subcategories have been used.
For example, the below example screenshots show the most common Defect Category is Plumbing and Heating Systems (17) and the most common Defect Subcategory is Boiler Failure (5).
Defects Report
The Defect Report section details the categories and subcategories used for Defects.
This information is exportable to PDF or Excel by main category or subcategory.

Was this article helpful?
That’s Great!
Thank you for your feedback
Sorry! We couldn't be helpful
Thank you for your feedback
Feedback sent
We appreciate your effort and will try to fix the article